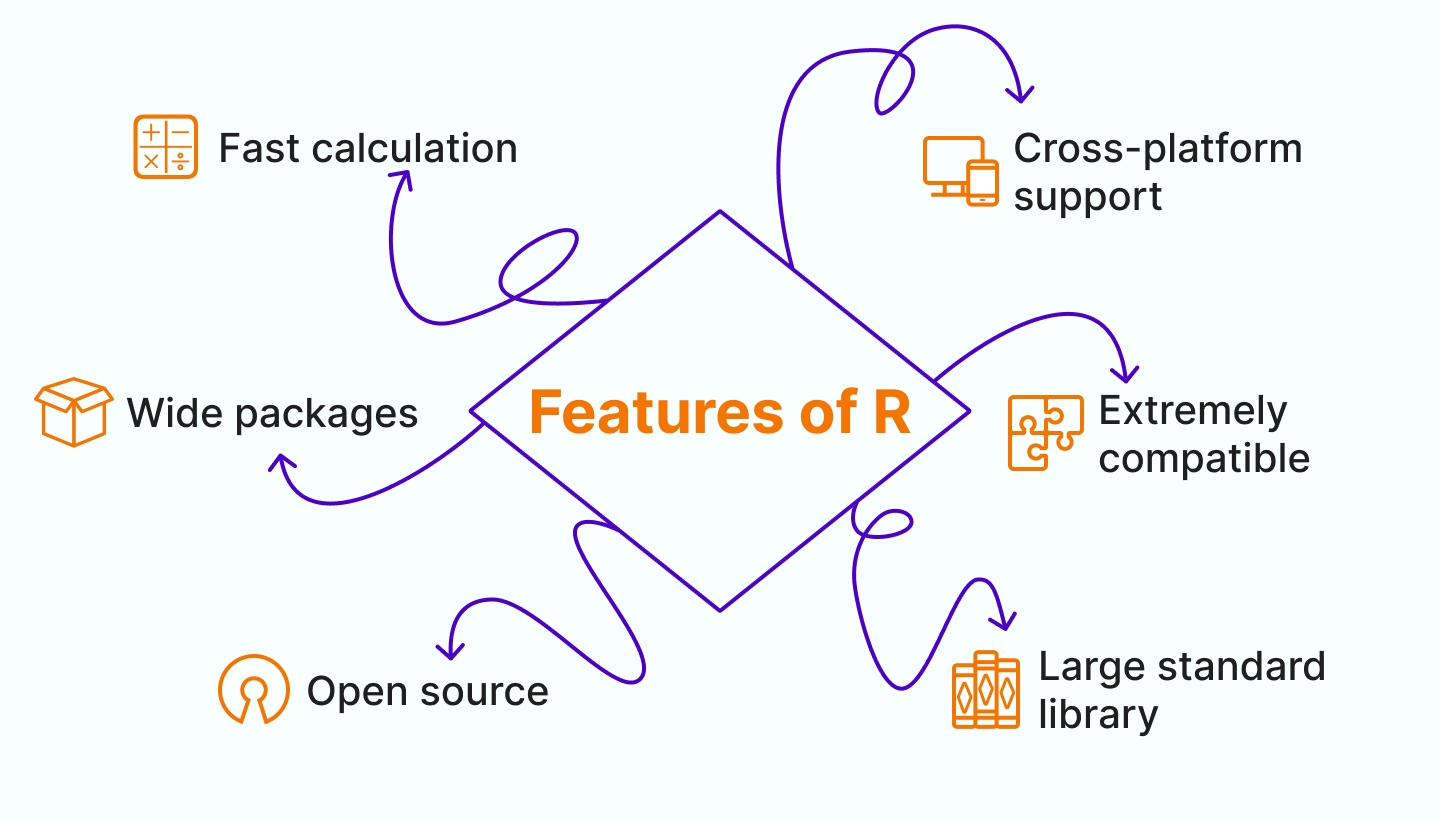
R is an open source programming language. It is used for static data processing, graphics, "primary" analysis and advanced mathematical modeling. The programming language has a unique syntax and framework for running programs. R is actively used in AI and machine learning.
At first glance, the programming language may seem quite complex. In fact, it is quite simple and logical. R was created by developers for scientists who have experience and knowledge in mathematical analysis, static methods, and probabilistic deviations. It has a number of advantages:
Code in this programming language can be run without compilation, because it uses an interpreter that demonstrates how the program works in real time;
R differs in efficiency and performance through a vector approach.
The R programming language is used to work with data:
- collection and analysis of data from various sources;
- search for patterns and deviations;
- verification and confirmation of hypotheses;
- data visualization in a variety of ways;
- work with statistical data in order to detect anomalies.
It is also worth noting the use of a programming language in machine learning and neural networks. With its help, it is quite easy to create a deep learning model. Furthermore, R is widely used in other popular areas.

Application of R in Data Science
When it comes to data collection and processing in IT, the R programming language has become a kind of gold standard in this area. It makes life much easier for programmers and has the following advantages:
- lots of good libraries for data analysis;
- free ecosystem with GNU license;
- compatibility with Windows, Linux, macOS, Solaris;
- syntax, created specifically for data analysis.
Data visualization with R
A large number of libraries with almost limitless possibilities have been created for data visualization. Add-ons significantly expand the capabilities for creating machine learning models. Also plugins have been developed for working with data in the field of biology and other related areas.
Ggplot2 and plotly, libraries for data visualization, caused a great interest in the R programming language. These are the most popular tools in the work. They help to visualize data in the form of diagrams, graphs and tables.
R programming language development environment
The Integrated Development Environment or IDE is a convenient wrapper for R. The R programming language is a computing environment. In other words, this is a kind of calculator for working with data, graphics, tables, it is actively used in building mathematical models. The following tools are used:
- Rgui is represented by a graphical interface in the form of a command line window. For complex operations, there is a script window where you can write a script or program. The software environment has a graphics module that displays graphs.
- Rstudio is an integrated development environment with additional charting modules and editing history. The shell is popular among developers due to its convenience. It has color highlighting and automatic code completion. R in the Linux terminal is more suitable for analyzing and processing a large amounts of data through a server or supercomputer.
R is a highly specialized programming language created by statisticians for the work of extras. It is the best option for processing and visualizing huge amounts of data due to its high functionality and efficiency. Any other AI language doesn't demonstrate such high performance, efficiency and usability as the R programming language does.
